Full Bulletin: https://bit.ly/35gaRO2
Summary:
The 2012 USDA Forest Service Planning rule requires that National Forests incorporate mitigation and adaptation strategies in response to climate change into their forest management plans. An underlying foundation of this work is knowing the distribution of aboveground biomass across the landscape. Climate change may put some areas with high biomass at greater risk for carbon emissions from wildfires, whereas other areas with reduced risk of wildfire may be preferred locations to manage for increased carbon storage.
With a grant from National Aeronautics and Space Administration’s (NASA) Carbon Monitoring System (CMS) Program, Andrew Hudak, a research forester with the Rocky Mountain Research Station, led a team to develop aboveground biomass maps for Idaho, Oregon, Washington, and western Montana. These annual maps, which span the years 2000–2016, will be useful for developing carbon budgets for National Forests and identifying areas needing fuel treatments to reduce wildfire risk.
Building upon the success of the project, NASA provided additional funding for Hudak and his team to create maps of other forest attributes, such as basal area, volume, and canopy fuels. The goal is to map biomass and other forest attributes of interest to forest managers annually for the whole western United States, from 1984 through 2020.
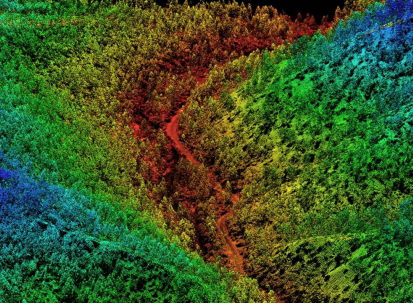
Image Credit the source. Caption: The first LiDAR systems became available in the 1970s. Combining it with global positioning system (GPS) advances in the early 1990s made it a powerful yet mostly unexplored tool to measure forests. Collecting LiDAR data requires outfitting an airplane with an airborne laser scanning system (ALS). As the airplane flies above the landscape, light in the form of a pulsed laser is directed at the ground. After the light strikes a physical surface, whether a branch, a shrub, or the ground, the light returns to the sensor. The time elapsed for the laser pulse to return to the sensor, which occurs at the speed of light, can be translated into distance. These return signals are processed along with the real-time GPS and aircraft position data to create a 3D point cloud of the landscape, which can then be rendered in mapping software into a map of the landscape that depict physical attributes. For example, this map shows the elevation gradient of the landscape, with red being the lowest point and blue being the highest point (illustration: J. Evans).

